
Outcomes
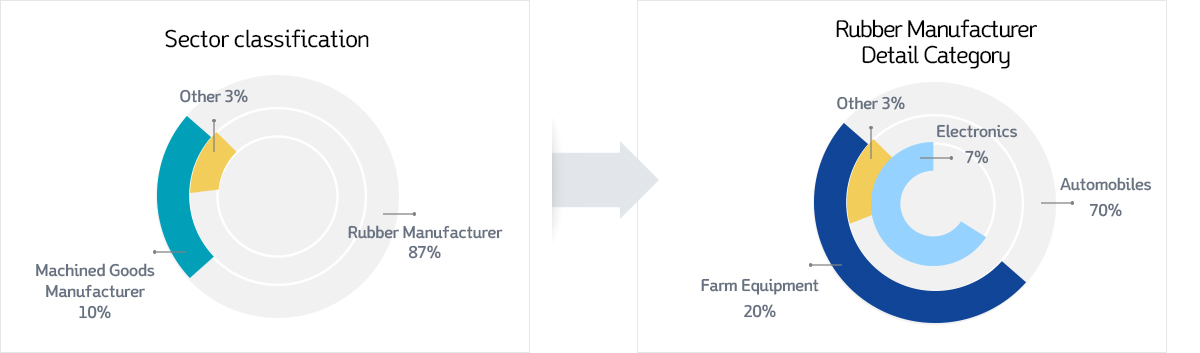
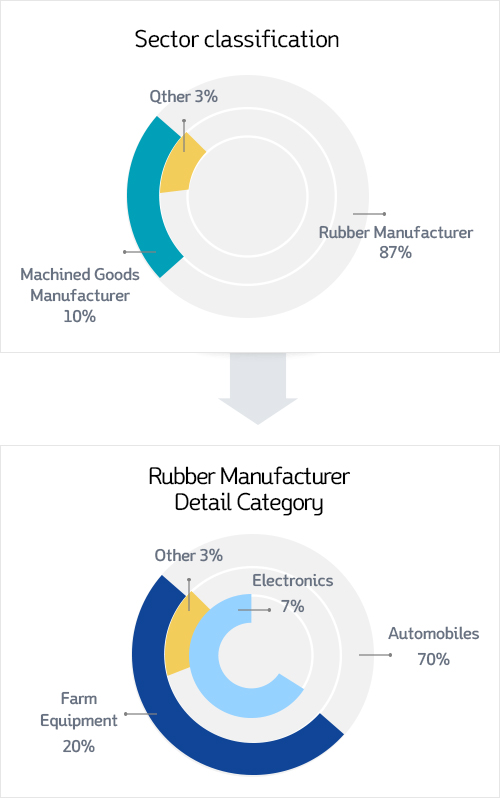
Share by Sector
Production Performance by Manufacturing Process
Production Capacity by Process
| No | Process | Production Capacity (EA/month) |
roduction Performance (EA/month) |
CAPA |
|---|---|---|---|---|
| 1 | Shot machine | 5,000,000 | 3,800,000 | 76% |
| 2 | Coating equipment, | 26,000,000 | 18,000,000 | 69% |
| 3 | PH adhesive | 12,000,000 | 6,000,000 | 50% |
| 4 | Auto underlay | 1,060,000 | 530,000 | 50% |
| 5 | Adhesive auto outer ring | 860,000 | 430,000 | 50% |
| 6 | Adhesive water iron | 600,000 | 300,000 | 50% |
| 7 | Adhesive non-shape adhesive | 3,440,000 | 1,720,000 | 50% |
| 8 | Automatic spray | 340,000 | 170,000 | 50% |
| 9 | Dipping adhesive | 1,000,000 | 500,000 | 50% |
| 10 | Adhesive dumbbell contact | 5,200,000 | 2,080,000 | 40% |
| 11 | 202AB adhesive | 2,430,000 | 730,000 | 30% |
| Total | 57,930,000 | 34,260,000 | 59% | |